System Monitoring
In the menu bar under Monitoring, you can search for and display values of a KPI that have changed in the selected period of time. You can also set or update an alert for a KPI. Because this function is being developed continuously, it is expected to include more functions from the SAP Monitoring Cockpit in the future. The SAP Monitoring Cockpit is a tool in the SAP NetWeaver platform that provides a centralized view of the health and performance of SAP systems and applications.
For a list of all default KPIs, see the chapter Complete List of Default KPIs.
There are two ways to open the Monitoring area:
-
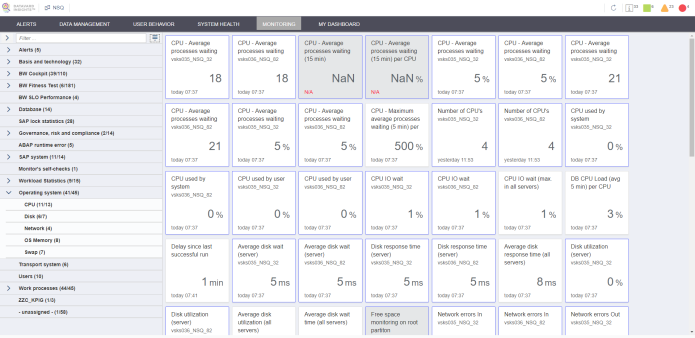
The first way is to select a particular system tile in the main view and click the Monitoring tab. You can view the KPI related to the selected tile. The time range displays the last measured KPI values.
-
2. The second way is to open the Monitoring area from the Alerts tab in the main view. In this case, you can view the KPI that caused the alert. The alert is from the time period that started shortly before the alert occurrence and ends shortly after the alert ends. For more information about alerts, see the chapter Alert List.
KPIs are divided into groups based on the settings of CrystalBridge® Monitoring in SAP GUI. For more information about the settings of KPI groups, see the chapter KPI Groups.
To find a specific KPI, you can use a filter. Tiles without data are not displayed.
The Monitoring area contains the tabs KPI chart and Alert list.